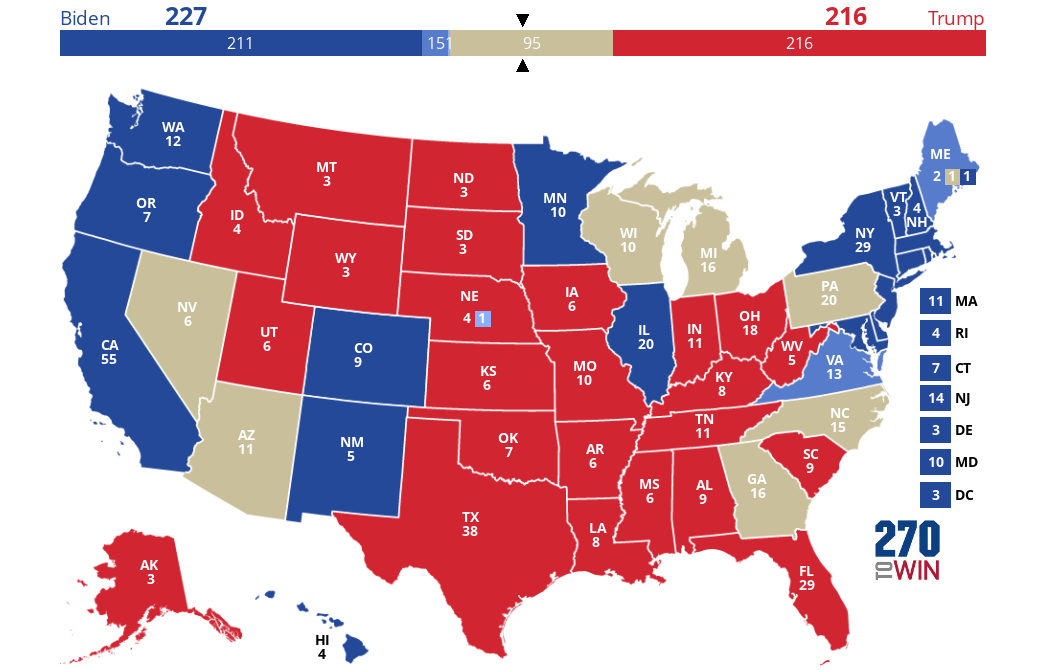
 Result as of 6:07 ET.
It is now 11PM ET. Trump is looking good towards his second term, and regardless of that, the turnouts are clearly in favor of him relative to the mainstream media polls.
The question is, where is the error coming from?
I write lots of things on my blog, including politics. However in this article I really wanted to look into the statistical aspect of the problem, instead of who is more correct politically or is more capable of making America great again. This article is not meant to be extensive -- I am sure there are more statisticians or data scientists who are more capable of giving precise figures than I do. This is a record of my own observation.
The traditional polls
In traditional statistics there are two stages in the process -- you first collect the data, then you do the inference.
When collecting the data there are two roles of course, the data collector and the samples.
On the data collector side things could be biased based on how the poll is done. These includes designing leading questions, or hinting the presupposition during the poll. While I do not have clear evidence for these -- well I did not look into the polls -- we have another potential sampling error here. That is, to sample from an unrepresentative pool.
There are a few categories where polls may look into. They either take samples from adults, registered voters or likely voters. Likely voters of course have a (much) higher chance of voting hence are more influential. A number of mainstream media polls focused on adults of registered voters only, and that seemed to be dems biased -- or maybe because they know that collecting data in this way could be biased in the favorable way so that they decided to take such method?
Responses from the crowd certainly heavily affect the outcome. First the weighing might shift from what happened in 2016 or even 2018, especially given the volatile political environment right now. Even assuming that to be constant, the big problem comes from the 2020 version of the Bradley effect -- how many voters are the so-called shy-Trump-voters who are not willing to express their opinion in the polls? People are skeptical about that, while big data and early results say otherwise. Bradley effect is clearly taking in place.
Now we look into the inference part. If we believe that the poll makers will follow the moral of statistical inference (which is a bold statement to make from what's been observed), then what could go wrong?
It's mainly about the margin of error [https://www.pewresearch.org/fact-tank/2016/09/08/understanding-the-margin-of-error-in-election-polls/] -- when you give a confidence interval on the lead instead of of the poll percentage, the margin of error is doubled. That's because whatever that does not go to one party -- let's assume that the liberal party...or Kayne West are negligible -- goes to the other, creating a doubled difference.
Alternative methods
There are a few polls who tried new methods of investigating shy voters. Trafalgar group adopted a mixed method [https://www.thetrafalgargroup.org/polling-methodology/] in order to prevent the "social desirability gap". Democracy Institute tries to figure out the true preferences of the voters by asking extra questions like whether or not they think Trump will win, or who they think their neighbors would vote for. Although Project538 apparently does not like the method, but traditional methods are off as far as we observed. That may as well open a whole new area on studying how to obtain the true data when interviewees intentionally hides their true preferences.
Of course there are models too. These models in nature aimed to figure out the willingness of people voting for particular candidates without really making a poll. These include the famous Primary model [http://primarymodel.com/]. Others include a delayed correlation on media noise and so on. Some of these are also digitalized and measured on online platforms.
Interestingly these are in general more favorable towards Trump -- some even gave predictions that are too good to be true. For example the Primary model predicted 362 -- while 300-plus isn't impossible, anything above 320 seems very unlikely. The thing is that the electoral college is not a smooth scale. Not only that the electoral votes jump according to the votes assigned to the states, it's also because states beyond 320 are all deep blue. The chance to flip any of them would be exponentially harder than the swing states. While the models are designed to reflect who will win, they may not extrapolate to landslide victories.
Models that are not done state-wise is certainly having similar problems. They failed to distinguish what happened in different states, and that could produce a huge difference when it comes to votes predictions.
One final thought
The unusually high voting rate is special for this election. Given the same poll result, the outcome with a lower voting rate will certainly be different with the outcome with a high voting rate. That is because the group of people on the edge of going or not going to vote, is also not scaled smoothly.
This is hugely different from elections in Hong Kong, where we may comfortably assume that pro-government voters are fully utilized regardless of the overall willingness to vote. Thus any extra votes will be heavily biased to the pro-democracy side.
Such assumption is false for the US election, because the voter composition of both parties are highly sophisticated and dynamic. We can easily give numerous reason on why the extra votes would be biased on one party or the other.
For example, Biden supporters may say that extra votes are more likely for the dems. That's because we are observing a historical high on absentee ballots, which contains surely a lot more dem votes.
On the other hand Trump supporters are justified to believe that the extra votes are in favour of the reps: the rally showed that Trump supporters are more active and more motivated to vote. One also raised interesting observations that covid which triggered distant learning, which reduced peer pressure from college friends who are in general leaning to the dems.
If we keep going deeper, how does the the variation depends on the default stance of the counties (or, as shown on the polls)? Or variation against county population, income, age distribution and so on?
No matter what the answer is, we will learn much from exit polls of the current election. Together with all the new polling methods and models, there are too much for us to investigate, scientifically.
6:00 AM ET 4/11/2020 (yes, 7 hours after I started writing this, because the live feeds are overwhelmingly interesting to watch)
*At the moment WI, NV and AZ are in extremely close match. Oh this election is so interesting...


No comments:
Post a Comment